
|
|
|
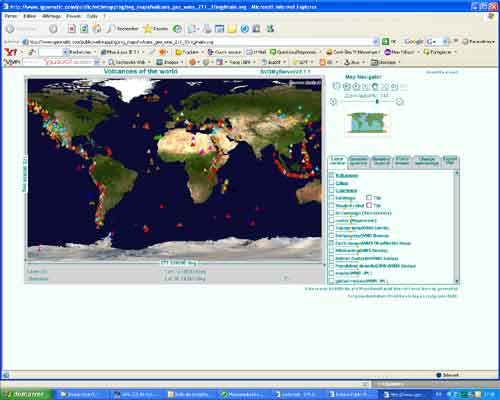
Once you were referred to an SVG full application. Presented is an example
of a universal cartographic server. It uses a MySQL database that store
vector data (topology POINT, MULTILINE, MULTIPOLYGON), and references
to raster tiles. Serverside, a series of PHP scripts deliver on-the-fly
SVG nodes for vector data and Client side, a series of Ecmascript files
manage navigation (thanks to carto.net SVG GUIs), requests, symbology
(constant or not sized symbols, ...) and the current SVG interactions
(onmouse events, ...).
An XML configuration file defines the symbol characteristics for each vector layer (id of the generic symbol, id of the CSS item, size of the symbol, id of the tag attribute, ...). The generic symbols are stored as SVG fragments without any representation attribute, in a specific table of the database and the specific symbols (a generic symbol plus a CSS file plus the configuration file) are created when the application is loaded and first integrated into the <defs> part of the main svg. The advantage of this solution : A user may change easily the symbologies afterword the project creation. |
The project is a client-server application, using only open-source tools. MySQL has been chosen for its presence on every provider plateforms. It lacks actually what makes the reputation of PostGreSQL+PostGis about spatial tools (centroid, bounding-box of each vector data, ...) but when the vector data is mainly POINT data, its ok.
A number of Web Map server may be easily reached. In this example, Demis, Sedac Population density and human footprint, Nasa BlueMarble, ...are displayed. Like any raster layer, a slider let the client modify the opacity. This permit to display more than one raster layer at the same time and is used for displaying scanmap layer plus hillshading layer...
A generic query-builder permit to query any of the Vector data layers. It uses JSON technology. A next version will permit to select a keyword to perform better queries.
A photographic diaporama tab has been implemented. Associated with a new button (P) close to the classical I (info tool), it permit to display one or N photographs of any vector object.
In this example, all the data is unprojected, using EPSG code 4326. Longitude and Latitude (WGS84) are displayed.
The plate-forme deal with any projection system but do not reproject data
in this version.
Two updates are to be made: Client side, a Javascript file will deal with
projection formulas in a way to on the fly display geographic coordinates
and projected coordinates. Serverside, the use of the Proj4 library or any
other PHP library would permit to reproject vector data when the SVG fragment
is created.
A specific attribute (declared in the configuration file) may be displayed
close to the point, or on the centroid of the polygon or along the path of
a vector line). In this version, no algorithm is used to help to find the
best position of labels. Only the scale level is taken into account.
Scale level:
-For point symbols, two different symbols are possible, the treshold beeing
declared in the MainMap (svg) file.
-For data stored in the database (vector data and raster tiles), the min_scale
and max_scale are defined in a specific attribute, like for min_scale_label
and max_scale_label.
-For line and polygon, the stroke-value is recalculated for each scale level,
according to an initial value.
Legend:
A legend is displayed and updated with the layers that are currently displayed.
It has been chosen to separate the layer control tab and the legend tab. The
scrollbar is automatically updated regarding the number of rows for the legend.
(the same principle is used for Layer control scrollbar and attributeBox scrollbar,
this box beiing movable)
Animation:
An animation is possible along the path of any
line. This functionnality is not given in this example but you have a good
idea of it on the Saleve project (French version only) with the layer called
"trails". The animation is active only when the scale level is big
enough. It corresponds to the level when a red cross appear in the Overview
map.
The tool uses animation of a point symbol along the path of specific lines.
Example provided by Pascal Benoist
| Last modified:
Tuesday, 10-Dec-2019 21:28:46 CET
© carto:net (andreas neumann & andré m. winter) original URL for reference: https://old.carto.net/projects/pascal_benoist/index.shtml |