
|

|
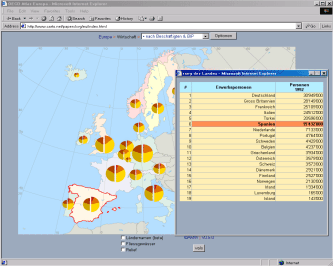
If you click on the screenshot to the left or on this link you will be referred to an SVG-file in full view with a simple menu on the top. Presented are the countries of europe and the near neighbourhood. In the background we have put a hill-shading. After choosing a diagram-type from the menue and a short calculation-time different diagrams appear, that get their data from embedded original data in form of a javascript array and are dynamically generated. Countries that have data associated reveal global information and ranking if you click on the countries area or diagram according to the chosen variable. We used economic data (Fischer Weltalmanach, 1995), the vector data and the shading is used from the "Atlas of Switzerland - Interactive (2000)". The atlas can also be entered with an animated SVG intro. |
The interface uses a frameset with three parts, the top is to choose topics and maps, the middle frame holds the map and the bottom one offers some general switches. Functions are to be found within the header of all containing html-files, the main diagram generating functions are in the bottom frame. All files have (german) comments within the javascript, the html and the svg code.
Main functions are the diagram generating ones and the part generating a data window when clicking on the countries or diagrams.
Files from the interface can be accessed individually here in order to study the source code, but keep in mind that you should start the application from the frameset
Processed and exported to SVG with CorelDRAW 9. The map is a prototype designed 2000 for Adobe SVG Viewer 1, but fully functioning. No more updates are planned, file headers and scripts will not be updated for newer viewers or specifications. See file eu_pie.txt for other technical comments and versions.
Example provided by André M. Winter
| Last modified:
Tuesday, 10-Dec-2019 21:39:50 CET
© carto:net (andreas neumann & andré m. winter) original URL for reference: https://old.carto.net/papers/svg/samples/diagr.shtml |