
|
|
Report by Andreas Neumann, Olaf Schnabel and Juliana Williams
The SVG.Open 2005 conference is the fourth conference in this series and took place in Enschede, a town in eastern Netherlands. The main organizer was Ruud Steltenpool from Twente University, who was assisted by Barend Köbben from ITC and Johan Koolwaaij from Telematica Institute. The conference took place at the campus of Twente University, which is situated in the north-west of Enschede. The campus is very green and spacious and made accessible through bus lines and bike lanes, common in the Netherlands. It is fully equipped with WLAN. Participants were offered free WLAN access during the time of the conference. The organizers did a great job and people really enjoyed the conference. They even produced live streams of the presentations and recorded some of them. The recorded videos will be made accessible on the SVG.Open website. All the provided papers and presentation slides are available at https://www.svgopen.org/2005 as well. A big "thank you" to the organizing team!
As to the statistics: the conference had 170 participants from many countries, naturally with a focus on european participants. 7 workshops, 67 presentations, 2 keynotes and 2 panel discussions. Among the participants were academics and researchers, employees from governmental organizations and administration, smaller content providers and/or consulting companies, open source programmers but also developers and/or managers from larger companies and organizations such as Canon, Cap Gemini, France Telecom, HP, IBM, Nokia, Opera, Sharp, Sun, Vodafone, Yahoo, etc. Unfortunately, there was no technical exhibition due to a lack of interest of commercial sponsors. The conference was sponsored and supported by the involved organizing organizations, as well as Vectoreal, W3C and Pilat Informatique.
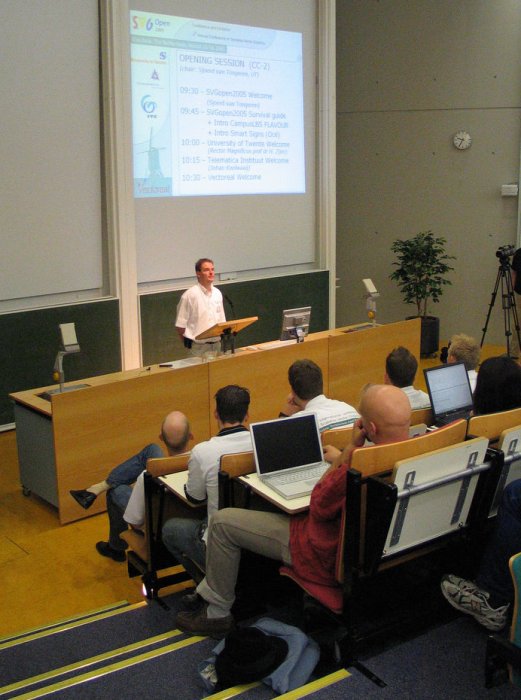
Barend Köbben in the opening session, photo by Mac Steve, flickr.com/photos/mac/sets/775975/
The conference started with a full day of workshops. Topics spanned from SVG for beginners, over topics such as scripting, SMIL animation, GUI design, integrating SVG in Mozilla Firefox, towards webmapping. One webmapping workshop was for beginners while the other workshop targeted more advanced developers who are interested in serverside SVG generation and the integration of WMS services.
The presentation sessions were organized in three parallel sessions with tracks on the following topics: Art and Design, Application Building, Data-connections, Data-Mining & Visualization, Evangelism & Specs, Geo-Information, SVG Authoring, SVG Mobile/LBS, Tools, User Interfaces, Vectoreal Commercial Track. The two keynotes and panel sessions were organized in one single track. One of the keynotes presented the use of SVG in a multinational car insurance company, where SVG graphics of car parts and accessories linked to database information help to do quick cost estimates in a distributed environment. The other keynote was given by Kurt Cagle who talked about the vision of SVG in the wider XML and web world where he emphasized that SVG is only one, but a very important puzzle piece in the whole system of the WEB Version 2. In his presentation he also encouraged the SVG community to hold out until the viewer situation improves and to continue and strenghten the SVG community support and SVG evangelism. Current SVG developers and content providers are important messengers to spread out the word of SVG and to make more web developers and content providers aware of SVG and its opportunities.
Keynote from Kurt Cagle, photo by Mac Steve, flickr.com/photos/mac/sets/775975/
It was very good to have the developers of the SVG viewers and web browsers at the conference. As to desktop browsers, it seems like all web browsers except Internet Explorer are currently active in implementing SVG as a native browser technology. Developers from Opera, Mozilla SVG, KSVG, Batik, Sun, Nokia, Ikivo and Opentext/Bitflash, Evolgrafix/Renesis were present at the conference. Currently, Opera supports SVG tiny (with animation) plus gradients. The Opera SVG implementation is still missing CSS support, scripting/DOM, SVG fonts, patterns and a number of other things. Mozilla SVG has a rather complete DOM/Scripting and CSS support but still lacks SMIL animation support, SVG fonts, patterns and filters. The interesting thing about Mozilla SVG is that it integrates well with the other browser technologies. It is possible to access the SVG DOM from the XHTML DOM. XBL and foreign elements work partially. KSVG recently made some good progress and is in a similar state as Mozilla SVG. Scripting/DOM works, so does CSS and patterns/gradients. It still lacks support for SMIL and SVG fonts. Also, it is not yet possible to access the SVG DOM from XHTML or other way round. Fortunately, it seems like the Apple Safari/Webkit developers are now interested in SVG as well. For that reason, Rob Buis (the main KSVG developer) recently restructured his project for better collaboration with the Apple developers. All SVG developers who work on native browser integration currently target SVG 1.1, but are still hesitating with supporting SVG 1.2 in its current state. They claim that the current SVG 1.2 working draft contains too many non-graphical issues and that these would be better moved to another working group. There is also some overlap with other web technologies, such as the XHTML DOM methods and CSS. The SVG working group is aware about these problems and tries to improve them by forming new non-SVG working groups that should work on these topics.
Evolgrafix presented their Renesis SVG initiative, which is a framework to cover the whole production workflow to publish interactive graphics, multimedia and web applications. Components include a SVG 1.2 compliant SVG viewer (both as a plugin/component, but also as a standalone application), serverside generators, a SVG graphics and development environment, database connnectors and visual components to build data-driven web applications. At least the SVG viewer component is designed to run on all major platforms and as a plugin in all major browsers. It builds on the open source AGG library, which is developed by Maxim Shemanarev, a talented russian graphics programmer. It is obvious that there is a need for such a compliant, complete and multiplatform viewing solutions. It was also apparent that many SVG content developers felt disappointed about the lack of SVG support by Adobe, which currently forces them to develop SVG applications almost solely for intranet applications, due to a lack of browser and platform support and browser integration problems. At the time of the conference, it is however still not clear if the Renesis solution will be able to solve all these problems. Currently, there is no beta version available to judge the quality of the Renesis SVG viewer. Evolgrafix wants to deliver their viewer by the end of the year 2005. They seem to be working on a few technologies to speed up the rendering of SVG content, such as bitmap caching and binary SVG/XML to speed up the loading and parsing of the content. We are all looking forward to finally being able to test their solution.
In the SVG working group panel, Chris Lilley and others gave a status report on the current SVG working group activities, such as the several SVG profiles. Work on the SVG 1.2 mobile profile is more or less finished. This mobile profile is long awaited by the mobile industry and will be part of or referenced by other mobile specifications, such as JSR 226 or the 3GPP specifications. SVG mobile viewers are currently developed by Sun, Nokia, Ikivo (former Zoomon) and Opentext (former Bitflash). Once the SVG 1.2 mobile profile is finished and approved, the efforts willshift towards the full profile and the related activities, such as XBL, binary SVG, CDF (compound document format) and web applications framework. Most of the current SVG working group members also show a lot of interest to this integration and neighbor technologies. Many SVG developers and companies are unhappy with the slow speed the SVG 1.2 specification moves forward. Members of the working group rightfully pointed out that it would be much better if those complaining companies/individuals would participate and contribute to the efforts of the working group to speed up the release of the specification. Many SVG viewer developers also pointed out that the current SVG 1.1 test suite is insufficient for really ensuring interoperability. The working group promised to improve the test suite and also encouraged the developers to contribute test cases. They will also provide a RelaxNG schema for better validation.
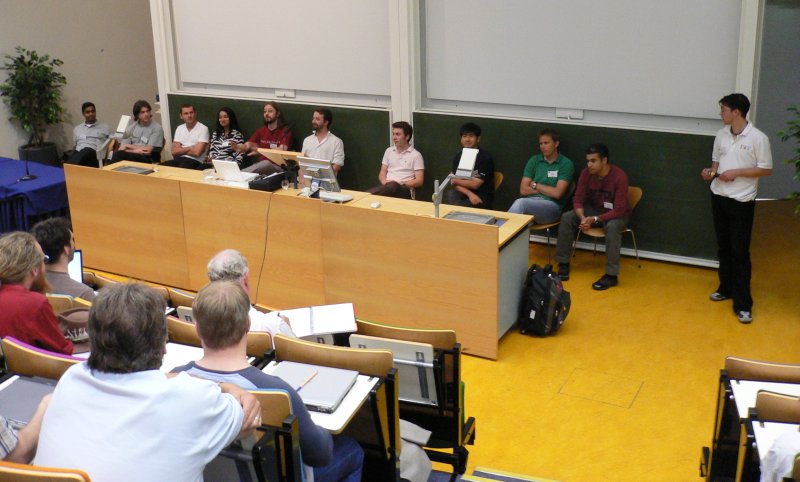
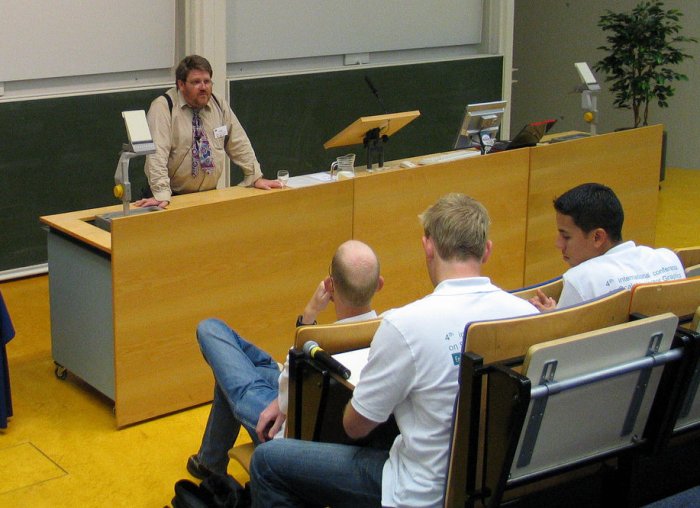
W3C SVG working group panel, photo by O. Schnabel
The geoinformation track presentations covered interactive topographic maps, weather maps, workflow issues, OGC integration, styling issues, navigation and interactivity. Klaus Förster from the University of Innsbruck presented the recent developments at the Tyrol Atlas project: topographic maps with the integration of georerenced photos, a profile function and the display of GPS data. Juliana Williams from ETH Zurich presented the interactive hiking map of the Yosemite National Park with detailed hiking information, animated hiking trails, interactive profiles, georeferenced photos and additional information. She also outlined the workflow on how to generate interactive SVG maps from geographic databases, including a level of detail concept and automatic label placement. Andreas Neumann, also from the Institute of Cartography, ETH Zurich, discussed navigation in space, time and topic, gave an overview on possible navigation controls as well as the interdependencies between the different navigation modes and the dependent visualization. He also presented an early prototype of an european map of cultural heritage with timeline navigation and database connectivity. Thomas Brinkhoff from the University of Applied Sciences, Oldenburg, discussed styling options that are compatible with both the OGC SLD (styled layer description) language and the W3C CSS specification by extending CSS with an additional rule selector. They are working on a prototype implementation of a SVG mobile viewer that can parse and interpret this declarative CSS approach.
Bruce Rindahl presented how their Colorado based consulting company uses SVG to display realtime weather data to be used in online flood alert systems. Their support systems integrate data from various data sources, including rainfall totals, streamflow values, radar images, weather readings, meteorological models and aerial photographs. The system uses interactivity and animation to visualize present and past weather situations. It uses a mixture of XSLT, serverside SVG and XML generation, clientside scripting and SMIL to present the data. Basic map data is also loaded through the OGC WMS interface to the US Terraserver. Samuel Epstein from MITRE Coroporation, Massachusetts, presented how to create dynamic SVG webservices to display weather data. Using standard webservice infrastructure he implemented visualizations of wind situations (using wind barbs) and other parameters (using contour representations). Ralf Kunze, Robert Mertens and Oliver Vornberger from University of Osnabrück also presented a framework to publish interactive weather maps. Their framework consists of static background maps, templates for the user interface, PHP and MySQL and finally the SVG client. To visualize weather situations they also used isolines and iso-areas. Visualized weather parameters include cloud density, air pressure, precipitation and temperature. They also did first experiments with animations.
Dany Bouchard and Benjamin Campin from DBXGeomatics, Gatineau, Canada, presented their SVG/Mapinfo publishing solutions and examples generated using their technology. They presented GIS like queries and simple analysis as well as data aquisition (digitizing) tools. Benjamin Campin presented an approach for middle size SVG mapping applications that cannot rely on the presence on a spatial database. In this approach he uses vector and raster tiles. He discusses the creation and loading of the tiles and also two different navigation approaches. Hauke Christoph from Rostock University presented an approach of interactive SVG mapping systems for cadastral departments. The work is partially based on kvwmap, an open source webgis solution. Applications include the online analysis of geothermal potential and the online calculation of taxes for surface water runoff at sealed urban surfaces. Jean-Claude Moissinac, ENST, France, presented a framework based on Cocoon to generate "one thousand billion" of maps on the topic of french presidential elections where the user is able to set parameters in simple HTML forms or using an URL. Output is generated by cocoon using XSLT processing and serverside gzip compression. Annie Danzart and Christine Potier, also from ENST, France, presented a map publishing framework based on SVG, XML, MySQL, PHP and Javascript. The discussed example showed a prototype on population density in France. Cartogen is an automatic map generator that reads in parameters from an XML file that describes the user interface, the data sources, map content and symbolization. A graphical user interface written in Java facilitates the generation of these configuration files.
Tobias Dahinden and Urs Hensler, Institute of Cartography, ETH Zurich, presented the results of a diploma work that aimed to create a graphical application that helps non-programmers to create interactive SVG mapping applications. The tool aims to automatically generate SVG and ECMAScript code for the most common tasks, such as map layout, map layer controls, navigation controls and data display. The first evaluation results show that the tool might be useful for non-programmers but is not flexible and/or efficient enough to be useful for SVG developers that are already used to writing scripts. Igor Cabral et.al. from UFRN-Brazil presented their GIS developments GIAS 1 and GIAS Web. The latter is based on SVG and other open source serverside components, such as PHP and MySQL. One of their online examples was the presentation of undersea features, such as coral reefs.
Johan Koolwaaij, one of the organizers from Telematica Institute, presented a central database with cell-ids and signal strengthes that can be accessed for matching cell-ids with geographic coordinates. He wrote a python program which runs on series 60 mobiles that records signal strengthes, cell ids and GPS coordinates that can later be uploaded to a central database. The database is made available under a open-source like license. People who make use of the database are also expected to upload new data. This OS database is useful since it works across providers and there is no per-request fee involved. In the same track Kavitha Muthukrishnan et al from Twente University presented an indoor LBS system based on signal strengthes of Wi-Fi access points. The system could be tested by the conference participants during the conference.
In this track, Peter Schonefeld talked about the role of the designer in the development of the next generation web applications. He emphasized that the traditional workflows with a strict separation of designers and programmers does not work very well in today's creation of highly interactive user interfaces for web applications. He proposes the open process framework (OPF) as one way to guide the user interface designer and structure the workflow. This year's "SVG Wow" session was presented by Vincent Hardy, Sun Microsystems, who showed how to create optical illusions with SVG. Peter Edwards presented how their team (company e-2) created the "Story of Art", a multimedia presentation in the Tate Modern gallery in London. They discussed the challenges they had with the current SVG viewers and hardware, as well as the solutions they choose during the implementation. PHP and MySQL was involved in the serverside workflow.
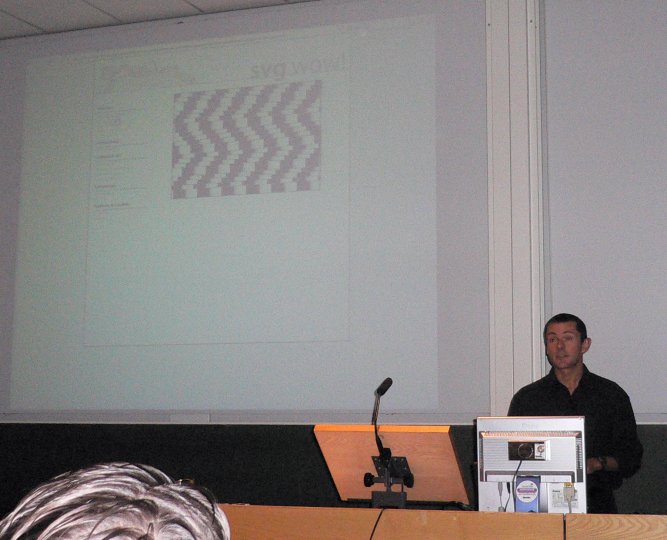
SVG Wow Presentation 2005, by Vincent Hardy; photo by O. Schnabel
In this track, Andrew Main presented PenDraw, a procedural Computer Graphics language that outputs SVG code. Jan-Klaas Kollhof presented the various options that SVG developers will have in SVG 1.2 to do network requests, incl. URLRequests and socket connections. Musbah Sagar, Oxford Brookes University, presented an alternative mouse event model for SVG which is partially derived from the Java mouse event model and should avoid the current problems we have with getting "out-of-synch" situations regarding the current mouse state. Two related projects were presented that implement Java2D and JavaSwing in SVG and ECMAScript. Christian Wenz and Tobias Hauser discussed similarities and differences between XAML and SVG. Craig Northway, CISRA/Canon, gave on overview on color models and advanced compositing, as targetted in the SVG 1.2 specification. His comprehensive paper should give a good overview for potential viewer implementors and content developers.
This track featured some interesting presentations on the use of SVG for user interfaces and as a complementary technology for graphical information systems and collaborative tools. Chris Peto presented his SVG interface for building management systems and online editing solutions. Cameron McCormack, Monash University, Australia, presented his current work on implementing some of the new SVG 1.2 features in Batik, such as sXBL. David Duce, Musbah Sagar and others from Oxford Brookes University presented their very interesting work on utilizing SVG for collaborative environments across the internet. A mix of SVG and RDF is used to present, annotate and replay data and events in a collaborative workspace. As an application they chose a firefighter incident where distributed firefighters could communicate visually using PDA like devices and share information they have at hand. RDF triples can be searched to look for a specific content within the environment/presentation. The "Open Overlay" project builds upon other SVG/JS libraries developed at Oxford Brookes University: a 2D graphics library and a SWING like UI library, as well as communication managers and the advanced mouse event model already mentioned in the "Evangelism and Specs Track". Both papers are very comprehensive and highly recommended.
John Whelan, University of Hull, UK, talked about his experiences in using SVG for teaching 2D graphics where students had to learn how to write well-structured and efficient SVG code and how to make use of the more advanced SVG features like filters or SMIL animation. In the paper he also summarizes student's feedback on the course and the use of the SVG technology. Egon Nijns, a software engineer from the university library of Leuven, presented a system for the localization of books within the library and the problems they had with deploying the system with Solaris clients. Qianyi Gu et al from University of Colorado, Boulder, talked about SVG applications as a visualization interfaces for distributed digital libraries where users can do a simultaneous search on different libraries and search engines and get a visual result using benchmarks and strand maps.
to be written ...
to be written ...
to be written ...
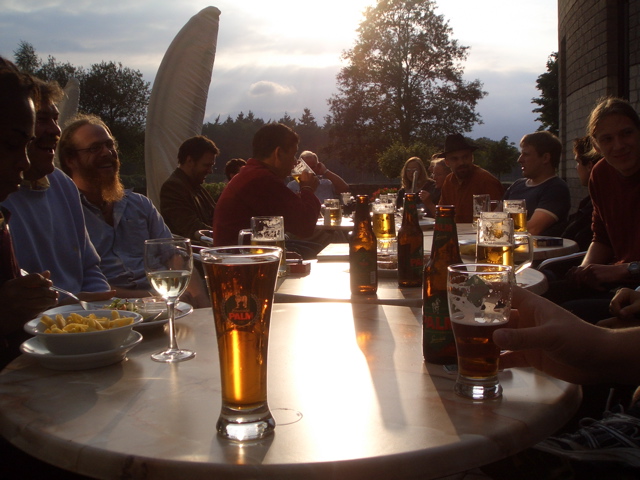 beer in the evening, swordfish.rdfweb.org/photos/2005/08/15/ |
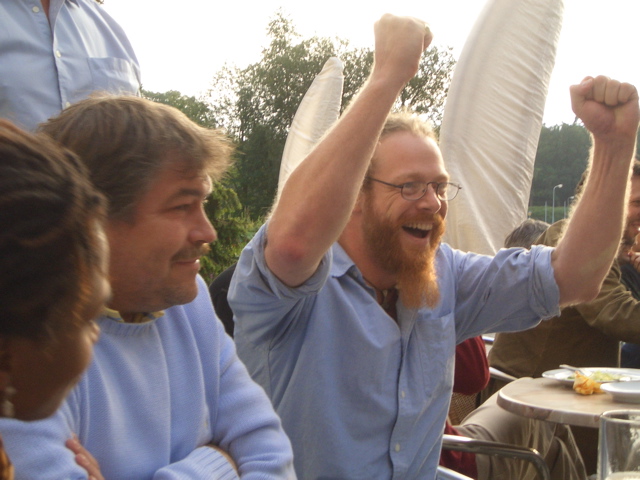 and it's a draw!, Foto by L. Miller, swordfish.rdfweb.org/photos/2005/08/15/ |
During coffee and lunch breaks people were able to discuss SVG related and other issues. During the conference, people also had wireless access to participate in IRC channels, email discussion and blogging. On Tuesday evening, the ITC institute offered an icebreaker event with drinks and small snacks. On Wednesday evening, many participants joined the dinner event that took place at the Enschede Rijksmuseum. Besides drinks and a dinner buffet, people could visit the exhibitions in the museum. The museum building with its courtyard was a very nice surrounding for such an event. On Thursday evening, some conference participants met for dinner at a turkish restaurant in Enschede's center. As SVG people walked by, the table grew longer and longer until we had about 40 people. Thanks to the good wheather during the week of the conference, we were able to enjoy dinner while sitting outside. After the evening events some people either explored Enschede's nightlife or met at the hotel bar. Due to the lack of sleep quite a few participants had bags under their eyes and had to regenerate during less interesting presentations ...
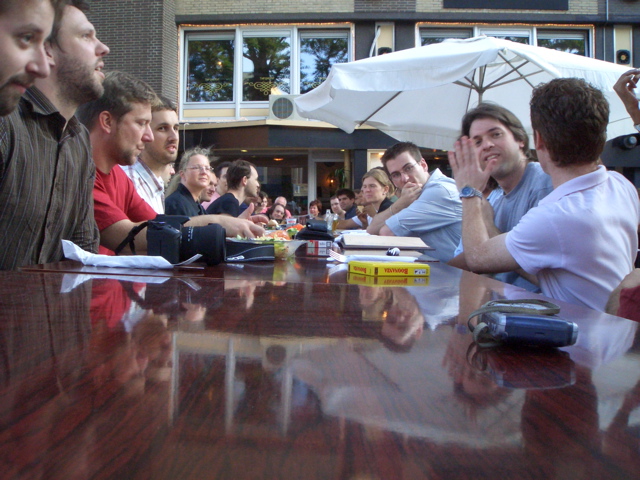 Dinner for 40 at Turquiose, Foto by L. Miller, swordfish.rdfweb.org/photos/2005/08/18/ |
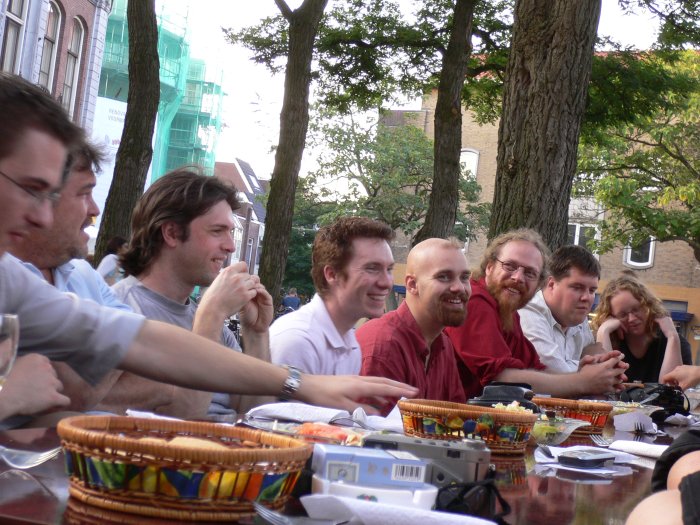 Dinner at Turquiose, Foto by O. Schnabel |
In the closing session Barend Köbben presented a SVG world map of the conference participants. Barend and Ruud thanked all of the organizers, the presenters and participants. Kurt Cagle talked about next year's conference: it will be held in 2006 in Victoria, British Columbia, Canada, with Kurt as the main organizer. Hope to see many of you there.
Ruud Steltenpool, one of the main organizers, closing session; photo by O. Schnabel
| Last modified:
Tuesday, 10-Dec-2019 21:59:27 CET
© carto:net (andreas neumann & andré m. winter) original URL for reference: https://old.carto.net /papers/svg/svgopen_reports/2005/index.shtml |